Presidential Elections and Outguessing the Stock Market
- Jun 25, 2024
- 3 min read
Updated: Sep 16, 2024
Presidential elections are emotional; and we will all read articles predicting the end
of the economy/stock market crash, if either candidate is elected. It is OK to be
passionate about your political beliefs, however, trying to outguess the market is
often a losing game. Current market prices offer an up-to-the-minute snapshot of
the aggregate expectations of market participants. This includes expectations about
the outcome and impact of elections. While unanticipated future events—surprises
relative to those expectations—may trigger price changes in the future, the nature of
these surprises cannot be known by investors today. As a result, it is difficult, if not
impossible, to systematically benefit from trying to identify mispriced securities or
systematic return patterns in election years. This suggests it is unlikely that investors
can gain an edge by attempting to predict what will happen to the stock market after
a presidential election. On average, stock market returns have been positive (11.57%
and 10.67%), both in election years and the subsequent year:

Of the 23 Presidential elections since 1928, the stock market had positive returns in twenty election years and negative returns in only four election years. The average annualized return for US Presidential Terms is 9.5%.

All four negative annual returns had “other” very significant events occurring at the same time:
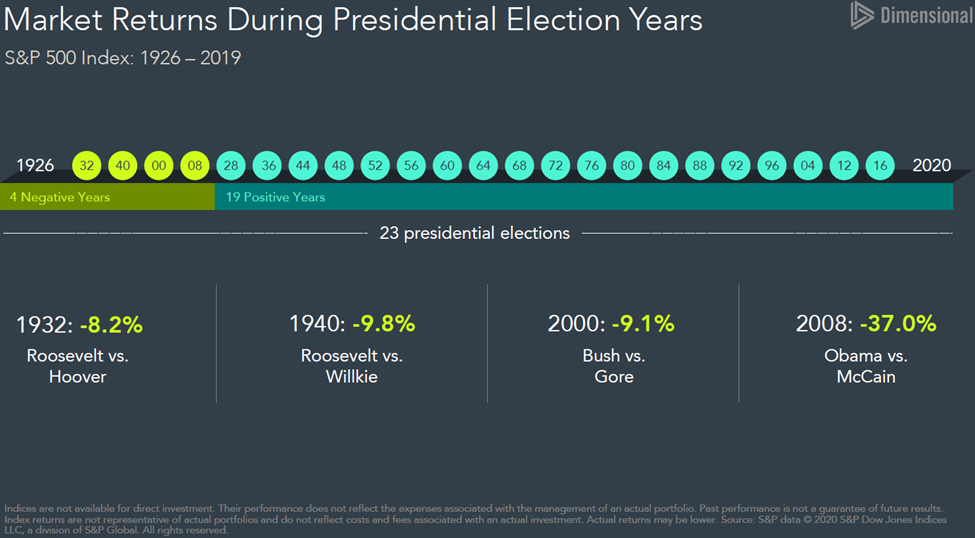
In 1932, the U.S. was experiencing the Great Depression, 1940 was World War II, 2000 was the tech crash after the bursting of the dot.com bubble, and 2008 was the Global Financial Crisis. Many factors are higher on the list than the Presidential election for influencing stock market returns.
We also can take a deeper look at both political parties for historical patterns. The Histogram below shows the frequency of monthly returns (expressed in 1% increments) for the S&P 500 Index from January 1926 to December 2019. Each horizontal dash represents one month, and each vertical bar shows the cumulative number of months for which returns were within a given 1% range (e.g., the tallest bar shows all months where returns were between 1% and 2%). The blue and red horizontal lines represent months during which a presidential election was held. Red corresponds with a resulting win for the Republican Party and blue with a win for the Democratic Party. This graphic illustrates that election month returns were well within the typical range of returns, regardless of which party won the election.

LONG-TERM INVESTING: BULLS & BEARS ≠ DONKEYS & ELEPHANTS
Predictions about presidential elections and the stock market often focus on which party or candidate will be “better for the market” over the long run. The graph below shows the growth of one dollar invested in the S&P 500 Index over ten decades and 17 presidencies (from Coolidge to Biden). This data does not suggest an obvious pattern of long-term stock market performance based upon which party holds the Oval Office. The key takeaway here is that over the long run, the market has provided substantial returns regardless of who controlled the executive branch.

CONCLUSION
Equity markets can help investors grow their assets, but investing is a long-term endeavor. Trying to make investment decisions based upon the outcome of presidential elections is unlikely to result in reliable excess returns for investors. At best, any positive outcome based on such a strategy will likely be the result of random luck. At worst, it can lead to costly mistakes. Accordingly, there is a strong case for investors to rely on patience and portfolio structure, rather than trying to outguess the market, in order to pursue investment returns.
Source: Dimensional Fund Advisors LP.
All expressions of opinion are subject to change. This information is intended for educational purposes, and it is not to be construed as an offer, solicitation, recommendation, or endorsement of any particular security, products, or services.
Diversification does not eliminate the risk of market loss. Investment risks include loss of principal and fluctuating value. There is no guarantee an investing strategy will be successful.
Past performance is not a guarantee of future results. Indices are not available for direct investment; therefore, their performance does not reflect the expenses associated with the management of an actual portfolio. The S&P data is provided by Standard & Poor’s Index Services Group.


