The LTWM Insider – Market and Economic Commentary Q4 2023
- Jan 16, 2024
- 12 min read
Updated: Aug 12, 2024

Executive Summary
The fourth quarter was exceptionally strong for stocks, so it was important to believe in the strength of the American consumer and the power of the Fed when stocks and bonds were hitting lows last quarter (see our last quarterly commentary here). Inflation continued to decline and the probability of the first Federal Reserve interest rate cut increased for the new year. The Fed has paused since its last rate hike in July of 2023. The first cut may be as early as Q1, most likely in Q2, but could be pushed out to the end of the year, or beyond, if the economy remains robust enough to keep adding jobs. We would like to see a long pause from the Fed based on the strength of the economy. Bond yields have already responded, moving down substantially across longer maturities, in anticipation of the first interest rate cut.
The last stock market record high was January 5th, 2022, and we are currently very close to the same level for the S&P 500. The momentum from 2023 is strong and will likely continue if the strength of the U.S. job market continues and U.S. consumer spending drives GDP and corporate earnings growth higher. The bond market is back in balance between sellers and buyers as a dovish change in language by the Fed caused a sharp reversal in longer term U.S. Treasury yields from short covering. The current sentiment of bond investors is an overwhelming agreement that the next move by the Fed will be a rate cut.
We are cautious due to the high valuation of U.S. stocks but remain optimistic on the U.S. job market and improved productivity from new technologies. We want to remind you we are watching all the developments closely, especially small-cap stocks, which performed very well during the last two months of last year. We look forward to our planning discussions for the new year and meeting with you, whether in person or virtually.
For those who would like a deeper dive into the details, please continue reading…
World Asset Class 4th Quarter 2023 Index Returns


The fourth quarter was very positive for all major index returns and most finished near highs for 2023. For the broad U.S. Stock Market, the fourth quarter return of 12.07% was well above the average quarterly return of 2.3% since January 2001. International Developed Stocks returned 10.51%, also well above the long-term average quarterly return of 1.6%. Emerging Market Stocks returned 7.86%, well above the average quarterly return of 2.5%. Global Real Estate Stocks returned 15.47%, assisted by much lower interest rates and well above the asset class’s average quarterly return of 2.3%. The continued decline in inflation and less threatening language from the Federal Reserve led to a sharp decline in bond yields during the quarter and enabled risky asset classes to perform well.
Here is a look at broad asset class returns over the past year (2023) and longer time periods (annualized):


For the past year, U.S. stocks led all broad categories with a positive return of 25.96%, International Developed stocks were up 17.94%, Emerging Markets stocks were up 9.83%, and Global Real Estate stocks were up 10.23%. The U.S. Bond Market gained 5.53% and Global Bonds were up 8.32% for the past year. Over the past five years, U.S. stocks were up 15.16% annually, while International Developed stocks were up 8.45% annually, Emerging Market stocks were up 3.68% annually, and Global Real Estate stocks were up 4.16% annually. The U.S. Bond Market was up 1.1% annually for the past five years, while Global Bonds were up 1.5% annually. Over the past 10 years, the U.S. stock market (up 11.48% annually) is well ahead of International Developed (up 4.32% annually), Emerging Markets (EM) stocks (up 2.66% annually) and Global Real Estate stocks (up 4.72% annually). U.S. Bonds were up 1.81% and Global Bonds were up 2.8%, annually over the last 10 years.
Taking a closer look within U.S. stocks during the fourth quarter, many asset classes had strong returns. At the top, for the second quarter in a row, is Small Cap Value, which was up 15.26%, while Large Growth was just over 1% behind, up 14.16% for Q4. Small Cap stocks (up 14.03%) and Small Growth (up 12.75%) were above Marketwide results of up 12.07%. There was a noticeable shift to small cap stocks during the last two months of 2023 and if the trend continues, it would be excellent for all stocks.

So far, there is no evidence of a systemic banking concern, including commercial real estate loans. The regional banking ETF, symbol KRE, recovered back to levels close to pre-crisis, prior to the collapse of Silicon Valley Bank during the fourth quarter. We believe almost all banks will make it through a period of higher default rates as lenders and borrowers negotiate new loans. The lower level of interest rates helps borrowers and American consumers as mortgage rates and auto loan rates decline, making asset purchases more affordable.
If we extend our analysis of U.S. stocks over longer time periods, Large Growth stocks lead over the past year, up an amazing 42.68% vs. 11.46% for Large Value. Interestingly, Large Value is tied with Large Growth over three years, both are up 8.86% annually. Large Growth has been the top returning asset class over the past 5 and 10 years. It is worth noting that U.S. Market wide results for the past 10 years are robust, up 11.48% annually.


The U.S. business cycle continues to slow, the Conference Board Leading Economic Index, which consists of 12 leading economic indicators has slowed every month for the past 20 months and is 23 months off from its previous peak. On average for the index, there is 10.6 months between a peak and a recession, so the current cycle is well past the average. The four-week moving average of initial claims for unemployment insurance are back down to the lowest level in the last year, which means the U.S. job market remains very tight; and until it falters, we are not likely to experience a recession in the near term.
The Fed has paused from hiking rates but continues to sell Treasuries and mortgages at a monthly pace of just under $100 billion, which has the effect of increasing yields. Higher interest rates in the U.S. create more demand for the U.S. dollar, which has appreciated against most foreign currencies. Japan’s central bank continues a strategy of Yield Curve Control (YCC) by purchasing bonds at all maturities and anchoring the short end of the curve near zero. The Japanese Yen has stabilized against the U.S. dollar and the stock market in Japan is at 33 year highs (March 1990), led by tech stocks.
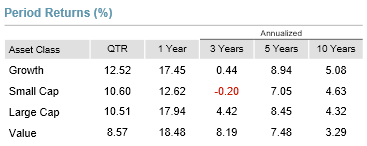
International Developed Value Stocks were up in local currency, but up more in U.S. dollars, since the dollar depreciated against most foreign currencies during the fourth quarter. The Euro went from $1.05 to its current value of $1.10. It is still down from $1.18 2.5 years ago. The currency effect served as a 5% tailwind, boosting international stock returns during the quarter. The value premium (Value-Growth) was negative 4% (8.57% vs. 12.52%), and the size premium was slightly positive (Small Cap-Large Cap, 10.6% vs. 10.51%). Our investment funds are priced in U.S. dollars (unhedged) and benefit from a weakening U.S. dollar:

Over longer time periods, the value premium (value-growth) is positive over the past 1 and 3-year period, but still negative for 5 and 10 years. The size factor premium (small cap-large cap) is positive in the past quarter, negative in the YTD, 1-year, 3-year and 5-year periods and positive over the past 10 years.

Moving the commentary to fixed income, bond market returns around the world were positive during the fourth quarter, as yields decreased for most bond maturities. The bond market is now predicting multiple interest rate cuts by the Federal Reserve in 2024, but the Fed’s QT (quantitative tightening) program of selling $90-100 billion of bonds per month is expected to continue for many years. The yield on the 5-year Treasury note decreased by 76 basis points, ending the quarter at a yield of 3.84%, down from 4.6%. The yield on the 10-year Treasury note decreased by 71 basis points, ending the quarter at a yield of 3.88%, down from 4.59%. And the 30-year Treasury bond yield decreased by 70 bps to 4.03%, down from 4.73%. All fairly large declines and as yields come down, bond prices increase, and lower borrowing costs allow consumers and corporations to purchase more. Here is the U.S. yield curve, and you can see how yields decreased significantly for all maturities longer than 6 months (current yield curve in grey, one quarter ago in blue, and one year ago in green). The current yield curve is very similar to one year ago, except at the short end:

Looking at fixed income asset classes, the highest fourth quarter bond return was for the U.S. Government Bond Index Long (long-term Treasuries), up an amazing 12.69% (recall the U.S. Government Bond Index Long was down -11.77% last quarter). The U.S. Aggregate Bond Index was up 6.82%. Short-term bonds were at the bottom end for Q4, after leading during Q3 and still have a 2.15% positive return annually for the past three years to lead all bond categories. The Aggregate Bond Index is down -3.31% over the past three years. Beware of the high volatility that can result from holding longer maturity bonds. Here are the fixed income period returns:

During the fourth quarter, the U.S. fixed income markets benefitted by a sharp decline in interest rates as a result of reduced inflation and much more dovish language from the Federal Reserve. The Fed continues its $8 trillion balance sheet reduction (selling bonds) at a rate of ~$95 billion per month or $1.1 trillion annually. The sharp drop in long-term yields caused many hedge funds that were taking advantage of the third quarter supply-demand imbalance by shorting the ETF that tracks the 10-year Treasury (TLT) to unwind or cover what was a very crowded trade. The result was more than buying, higher prices and lower bond yields that would otherwise be the case.
Historically, the Fed only lowers the overnight lending rate when jobs look to be in trouble, since its second mandate is full employment. Job trouble is usually stock market trouble. However, stocks can continue up with a long pause by the Fed now that the supply-demand imbalance in the Treasury market has normalized and jobs are plentiful.
Real GDP growth for 2022 (full year) was 2.1% and is now expected to increase to 2.4% in 2023 and then slow to 0.9% in 2024. Much stronger GDP growth numbers than the estimates from the beginning of the fourth quarter of 2023.
The stock market considers hundreds of factors to determine asset prices, some more important than others. One cannot time markets and typically the short term is just noise. Here is a sample of how the world stock markets responded to headline news, during the last quarter and the last year (notice the insert of the second graph that compares the last 12 months to the long term). We encourage you to tune out the financial news, since major news sources have a bias toward negative headlines; and often the headlines of the day have very little to do with the direction of stocks.


CONCLUSION
The positive run for stocks and bonds during 2023 will likely continue into the first quarter since the momentum during the final two months was so strong. The strong returns were due to the sharp decline in bond yields during the last quarter. The Fed changed its language enough to bring down Treasury yields. The labor market is holding up, GDP growth estimates have increased, and so far, major companies are not letting go of workers or if they are, new job openings are plentiful.
Our recommendation, as always, is to tune out the news and focus on what you can control with your financial well-being in the new year. We are here to help you succeed and look forward to seeing you soon.
Standardized Performance Data and DisclosuresRussell data © Russell Investment Group 1995-2022, all rights reserved. Dow Jones data provided by Dow Jones Indexes. MSCI data copyright MSCI 2022, all rights reserved. S&P data provided by Standard & Poor’s Index Services Group. The BofA Merrill Lynch Indices are used with permission; © 2022 Merrill Lynch, Pierce, Fenner & Smith Inc.; all rights reserved. Citigroup bond indices copyright 2022 by Citigroup. Barclays data provided by Barclays Bank PLC. Indices are not available for direct investment; their performance does not reflect the expenses associated with the management of an actual portfolio.Past performance is no guarantee of future results. This information is provided for educational purposes only and should not be considered investment advice or a solicitation to buy or sell securities. Diversification does not guarantee investment returns and does not eliminate the risk of loss. Investing risks include loss of principal and fluctuating value. Small cap securities are subject to greater volatility than those in other asset categories. International investing involves special risks such as currency fluctuation and political instability. Investing in emerging markets may accentuate these risks. Sector-specific investments can also increase these risks.Fixed income securities are subject to increased loss of principal during periods of rising interest rates. Fixed-income investments are subject to various other risks including changes in credit quality, liquidity, prepayments, and other factors. REIT risks include changes in real estate values and property taxes, interest rates, cash flow of underlying real estate assets, supply and demand, and the management skill and creditworthiness of the issuer.Principal Risks:The principal risks of investing may include one or more of the following: market risk, small companies risk, risk of concentrating in the real estate industry, foreign securities risk and currencies risk, emerging markets risk, banking concentration risk, foreign government debt risk, interest rate risk, risk of investing for inflation protection, credit risk, risk of municipal securities, derivatives risk, securities lending risk, call risk, liquidity risk, income risk. Value investment risk. Investing strategy risk. To more fully understand the risks related to investment in the funds, investors should read each fund’s prospectus.Investments in foreign issuers are subject to certain considerations that are not associated with investment in US public companies. Investment in the International Equity, Emerging Markets Equity and the Global Fixed Income Portfolios and Indices will be denominated in foreign currencies. Changes in the relative value of these foreign currencies and the US dollar, therefore, will affect the value of investments in the Portfolios. However, the Global Fixed Income Portfolios and Indices may utilize forward currency contracts to attempt to protect against uncertainty in the level of future currency rates (if applicable), to hedge against fluctuations in currency exchange rates or to transfer balances from one currency to another. Foreign Securities prices may decline or fluctuate because of (a) economic or political actions of foreign governments, and/or (b) less regulated or liquid securities markets.The Real Estate Indices are each concentrated in the real estate industry. The exclusive focus by Real Estate Securities Portfolios on the real estate industry will cause the Real Estate Securities Portfolios to be exposed to the general risks of direct real estate ownership. The value of securities in the real estate industry can be affected by changes in real estate values and rental income, property taxes, and tax and regulatory requirements. Also, the value of securities in the real estate industry may decline with changes in interest rate. Investing in REITS and REIT-like entities involves certain unique risks in addition to those risks associated with investing in the real estate industry in general. REITS and REIT-like entities are dependent upon management skill, may not be diversified, and are subject to heavy cash flow dependency and self-liquidations. REITS and REIT-like entities also are subject to the possibility of failing to qualify for tax free pass through of income. Also, many foreign REIT-like entities are deemed for tax purposes as passive foreign investment companies (PFICs), which could result in the receipt of taxable dividends to shareholders at an unfavorable tax rate. Also, because REITS and REIT-like entities typically are invested in a limited number of projects or in a particular market segment, these entities are more susceptible to adverse developments affecting a single project or market segment than more broadly diversified investments. The performance of Real Estate Securities Portfolios may be materially different from the broad equity market.Fixed Income Portfolios:The net asset value of a fund that invests in fixed income securities will fluctuate when interest rates rise. An investor can lose principal value investing in a fixed income fund during a rising interest rate environment. The Portfolio may also be affected by: call risk, which is the risk that during periods of falling interest rates, a bond issuer will call or repay a higher-yielding bond before its maturity date; credit risk, which is the risk that a bond issuer will fail to pay interest and principal in a timely manner.Risk of Banking Concentration:Focus on the banking industry would link the performance of the short-term fixed income indices to changes in performance of the banking industry generally. For example, a change in the market’s perception of the riskiness of banks compared to non-banks would cause the Portfolio’s values to fluctuate.The material is solely for informational purposes and shall not constitute an offer to sell or the solicitation to buy securities. The opinions expressed herein represent the current, good faith views of Lake Tahoe Wealth Management, Inc. (LTWM) as of the date indicated and are provided for limited purposes, are not definitive investment advice, and should not be relied on as such. The information presented in this presentation has been developed internally and/or obtained from sources believed to be reliable; however, LTWM does not guarantee the accuracy, adequacy or completeness of such information. Predictions, opinions, and other information contained in this presentation are subject to change continually and without notice of any kind and may no longer be true after the date indicated. Any forward-looking statements speak only as of the date they are made, and LTWM assumes no duty to and does not undertake to update forward-looking statements. Forward-looking statements are subject to numerous assumptions, risks and uncertainties, which change over time. Actual results could differ materially from those anticipated in forward looking statements. No investment strategy can guarantee performance results. All investments are subject to investment risk, including loss of principal invested.Lake Tahoe Wealth Management, Inc.is a Registered Investment Advisory Firm with the Securities Exchange Commission.

