The LTWM Insider – Market and Economic Commentary Q2 2025
- Jul 17, 2025
- 12 min read
Updated: Jul 31, 2025
Executive Summary
The second quarter of 2025 was strong for stocks, largely due to the announcement on April 9th of a 90-day pause on tariffs while trade negotiations proceed with key U.S. trading partners. The S&P 500 had dropped more than 12% in the four trading days following April 2nd—dubbed “Liberation Day” in markets—due to concerns over rising tariffs and their potential impact on global trade. Volatility, as measured by the VIX index, spiked above 50 on April 8th but has since settled around 16, a historically low level. The market responded positively to the tariff pause, with the S&P 500 rallying 9% on April 9th—its strongest single-day gain since October 2008. Since then, the S&P 500 is up 15%, and international equities have gained more than 20%.
International developed and emerging market stocks posted strong performance for the second quarter, the first half of 2025, and over the trailing year. While currency tailwinds helped in the second quarter, other drivers contributed to the relative strength of international markets. These include more attractive valuations, stronger-than-expected earnings growth, fiscal stimulus in Europe, a rebound in China’s tech sector, greater geopolitical stability in the Middle East and Ukraine, and uncertainty around U.S. trade negotiations. Valuations for both developed and emerging international markets remain well below U.S. levels, reinforcing the importance of global diversification in portfolios.
We remain cautious about the valuation levels of large-cap U.S. stocks. The S&P 500 Price-to-Sales ratio currently stands at 3.18—just shy of its December 2021 peak of 3.23, which preceded a difficult year for both stocks and bonds in 2022. At the same time, we remain optimistic about small-cap stocks and international markets. While trade negotiations remain ongoing, we are hopeful that constructive outcomes will emerge over the summer and that any future tariff adjustments will be manageable.
For those who would like a deeper dive into the details, please continue reading…
World Asset Class 2nd Quarter 2025 Index Returns
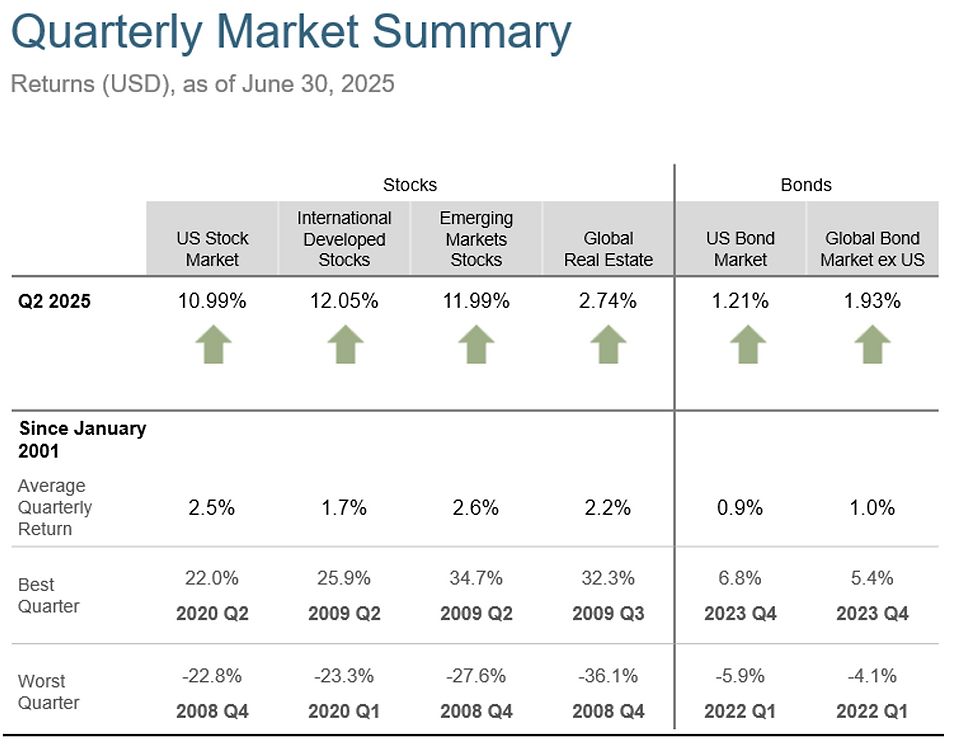

The second quarter of 2025 was extremely positive for U.S. stocks and all major global equity markets, while real estate and bonds were slightly better than an average quarter. For the total U.S. Stock Market, the second quarter return of 10.99% was well above the average quarterly return of 2.5%. International Developed Stocks gained 12.05%, well above the long-term average quarterly return of 1.7%. Emerging Market Stocks gained 11.99%, well above the average quarterly return of 2.6%. Global Real Estate Stocks were up 2.74%, slightly above the asset class’s average quarterly return of 2.2%. The U.S. Bond Market up 1.21%, above its average quarterly return of 0.9%, while the Global Bond Market (ex U.S.) was up 1.93%, above its average quarterly return of 1.0%.
Here is a look at broad index returns over the past year and longer time periods (annualized):


For the past one year and for the first time in years, International developed stocks are ahead of U.S. stocks (15.3% vs. 18.7% for International Developed stocks). Emerging Markets stocks were up 15.29%, and Global Real Estate stocks were up 9.96%. The U.S. Bond Market gained 6.08% and Global Bonds were up 6.09% for the past year. Over the past five years, U.S. stocks were up 15.96% annually, a very strong five-year period, while International Developed stocks were up 11.51% annually, Emerging Market stocks were up 6.81% annually, and Global Real Estate stocks were up 6.2% annually. The U.S. Bond Market was slightly negative, down -0.73% annually for the past five years, while Global Bonds were up 0.91% annually. Over the past 10 years, the U.S. stock market (up 12.96% annually) is well ahead of International Developed (up 6.65% annually), Emerging Market stocks (up 4.81% annually) and Global Real Estate stocks (up 3.88% annually). U.S. Bonds were up 1.76% and Global Bonds were up 2.68%, annually, over the last 10 years.
Taking a closer look within U.S. stocks during the second quarter, Large Cap Growth took the top spot, up 17.84%. well above market wide returns of a gain of 10.99%. Large Cap Value stocks (up 3.79%) were slightly below Small Cap Value stocks (up 4.97%). A challenging quarter for small cap and value stocks in the U.S market.

If we extend our analysis of U.S. stocks over longer time periods, Large Growth stocks still led over the past year, up 17.22% while Large Value, was up 13.70%. Large Growth has been the top returning U.S. asset class over the past 3, 5, 10, 15 and 20 years, outpacing the broad Large Cap category in each of the periods. U.S. small cap stocks are behind large cap stocks for the past 20 years, which has only happened two other times in history for rolling 20 year periods. The valuation gap between large cap and small cap stocks is also at an extreme, mostly due to the sharp rise in valuation of large cap stocks.

The U.S. stock market represents 63% of the global stock market, down from 65% at the start of year, due to the strong performance of international stocks. The U.S. business cycle continues to slow as measured by leading indicators, GDP growth is expected to be slightly lower for calendar year 2025 than 2024 (1.9% vs.2.8%). It is difficult to see GDP growth dropping near zero with the job market still strong, news of major investments in the U.S. from abroad and the passing of the One Big Beautiful Bill, which lowers taxes for individuals and for small businesses. The four-week moving average of initial claims for unemployment insurance is heading up near highs in the last year, but the U.S. job market remains very tight; and until it falters, we are not likely to experience a recession in the near term.
Moving on to International Developed stocks, which were strong in local currency and very positive in dollars for the quarter, due to the weakening of the U.S. dollar against most major currencies. International stock returns were helped by currencies movements in the second quarter, but there are many other reasons for the stronger performance in the past year. Europe and emerging market stocks trade at more attractive valuations than the S&P 500, which is near its highest valuation in the past 25 years. The countries in the Euro zone had stronger than expected earnings growth, with analysts revising future earnings higher. China’s tech sector recovery, including advancements in AI, along with supportive government policies and a large gains in Hong Kong’s stock market, contributed to strong emerging market performance. U.S. trade policy uncertainty affected U.S. stocks more during the correction in April. And better geopolitical stability in the Middle East and Ukraine and the corresponding reconstruction opportunities boosted international stocks. Historically, the relationship between U.S. and International stocks is cyclical with an average eight-year period of dominance between the two; and it appears the 20-year dominance of U.S. stock outperformance is transitioning to international stock outperformance. If history is a guide, the current favorable international trend could continue for years.
International Small Cap stocks led during the second quarter, gaining 16.82%, after currency adjustment, up 10.51% in local currency. Growth Stocks were second, up 13.64% in U.S. dollars, up 6.74% in local currency. The Euro went from $1.04 at the end of the 1st quarter to end the second quarter at a value of $1.18. The currency effect served as a strong tailwind, helping international stock returns during the second quarter:

Over longer time periods internationally, the value premium (value-growth) is negative for the past quarter, but positive year to date, over the past one-year period and over the past 3 and 5-year periods. The international size factor premium (small cap-large cap) is positive in the past quarter, year to day 1-year periods, negative in the 3-year, 5-year periods, and 10 years, and positive for the past 15 years (8.11% vs. 7.42%) and 20 years (6.47% vs.5.9%):

The International Developed Market represents 26% of the global stock market, up from 24% at the start of the year and Emerging Markets represent 11% of the global stock market, up from 10% at the start of the year.
Moving the commentary to fixed income, bond market returns around the world were mixed during the second quarter, as yields decreased for short and intermediate bond maturities and increased for longer maturities. The yield on the 5-year Treasury Note decreased by 17 basis points, ending the quarter at a yield of 4.28%, down from 4.45% at the end of last quarter. The yield on the 10-year Treasury Note increased by 1 basis point, ending the quarter at a yield of 4.24%, up from 4.23%. And the 30-year Treasury bond yield increased by 19 bps to 4.78%, up from 4.59%. As yields increase, bond prices decline, and higher borrowing costs make it more difficult for consumers and corporations to use debt, including auto loans and mortgages. Here is the U.S. yield curve, and you can see how yields decreased for short maturities and increased for long maturities (current yield curve in grey, one quarter ago in blue, and one year ago in green):

Looking at fixed income asset classes, the highest second quarter bond return was for the short duration world bond index unhedged (up 4.17%), while the worst return was for the U.S. Government Bond Index Long (long-term Treasuries, down -1.51%). The U.S. High Yield Corporate Bond Index was positive for the quarter (up 3.53%), so bond traders were not concerned about riskier lower quality bonds. The U.S Aggregate Bond Index was up 1.21%. It is worth noting that the long bond index was down -8.16% annually over the past five years, and is now barely positive over the last 10 years (0.15% annually). Long duration bonds can have significantly negative returns during periods of rising interest rates. Here are the fixed income periodic returns:

The stock market considers hundreds of factors to determine asset prices, some more important than others. Currently, inflation and the level of interest rates are two of the most influential factors for determining asset price movements. The uncertainty of the new administration’s tariff policy and amount of U.S. government debt held by other nations has increased the level of interest rates and inflation expectations. However, the Fed could decrease the amount of bonds it sells monthly or even stop quantitative tightening all together to create a bond rally, which would drop interest rates. While tariff deals with other countries have taken longer than expected to negotiate, any series of successful deals could spur more treasury purchases overseas.
One cannot time markets and typically the short term is just noise. Here is a sample of how the world stock markets responded to headline news, during the last quarter and the last year (notice the insert of the second graph that compares the last 12 months to the long term). We encourage you to tune out the financial news, since major news sources have a bias toward negative headlines; and often the headlines of the day have very little to do with the direction of stocks.


CONCLUSION
The second quarter was another great lesson in staying invested with a V-shaped recovery in April and new record highs by the end of June. Globally diversified portfolios were helped by the trend of International Developed and Emerging Market stocks performing well. The increase in yields held bond and real estate returns at much lower, but still positive, levels. The valuation of the S&P 500 remains near highs, but international and emerging market stocks, and even U.S. small cap stocks are more attractive. This is the reason we hold globally diversified portfolios, which we believe will continue to do well this year.
Our recommendation is to stay disciplined with investments, tune out the news and focus on what you can control with your financial plan in the new year. We are here to help you succeed and look forward to interacting with you soon.
Standardized Performance Data and Disclosures
Russell data © Russell Investment Group 1995-2024, all rights reserved. Dow Jones data provided by Dow Jones Indexes. MSCI data copyright MSCI 2024, all rights reserved. S&P data provided by Standard & Poor’s Index Services Group. The BofA Merrill Lynch Indices are used with permission; © 2024 Merrill Lynch, Pierce, Fenner & Smith Inc.; all rights reserved. Citigroup bond indices copyright 2024 by Citigroup. Barclays data provided by Barclays Bank PLC. Indices are not available for direct investment; their performance does not reflect the expenses associated with the management of an actual portfolio.
Past performance is no guarantee of future results. This information is provided for educational purposes only and should not be considered investment advice or a solicitation to buy or sell securities. Diversification does not guarantee investment returns and does not eliminate the risk of loss.
Investing risks include loss of principal and fluctuating value. Small cap securities are subject to greater volatility than those in other asset categories. International investing involves special risks such as currency fluctuation and political instability. Investing in emerging markets may accentuate these risks. Sector-specific investments can also increase these risks.
Fixed income securities are subject to increased loss of principal during periods of rising interest rates. Fixed-income investments are subject to various other risks including changes in credit quality, liquidity, prepayments, and other factors. REIT risks include changes in real estate values and property taxes, interest rates, cash flow of underlying real estate assets, supply and demand, and the management skill and creditworthiness of the issuer.
Principal Risks:
The principal risks of investing may include one or more of the following: market risk, small companies risk, risk of concentrating in the real estate industry, foreign securities risk and currencies risk, emerging markets risk, banking concentration risk, foreign government debt risk, interest rate risk, risk of investing for inflation protection, credit risk, risk of municipal securities, derivatives risk, securities lending risk, call risk, liquidity risk, income risk. Value investment risk. Investing strategy risk. To more fully understand the risks related to investment in the funds, investors should read each fund’s prospectus.
Investments in foreign issuers are subject to certain considerations that are not associated with investment in US public companies. Investment in the International Equity, Emerging Markets Equity and the Global Fixed Income Portfolios and Indices will be denominated in foreign currencies. Changes in the relative value of these foreign currencies and the US dollar, therefore, will affect the value of investments in the Portfolios. However, the Global Fixed Income Portfolios and Indices may utilize forward currency contracts to attempt to protect against uncertainty in the level of future currency rates (if applicable), to hedge against fluctuations in currency exchange rates or to transfer balances from one currency to another. Foreign Securities prices may decline or fluctuate because of (a) economic or political actions of foreign governments, and/or (b) less regulated or liquid securities markets.
The Real Estate Indices are each concentrated in the real estate industry. The exclusive focus by Real Estate Securities Portfolios on the real estate industry will cause the Real Estate Securities Portfolios to be exposed to the general risks of direct real estate ownership. The value of securities in the real estate industry can be affected by changes in real estate values and rental income, property taxes, and tax and regulatory requirements. Also, the value of securities in the real estate industry may decline with changes in interest rate. Investing in REITS and REIT-like entities involves certain unique risks in addition to those risks associated with investing in the real estate industry in general. REITS and REIT-like entities are dependent upon management skill, may not be diversified, and are subject to heavy cash flow dependency and self-liquidations. REITS and REIT-like entities also are subject to the possibility of failing to qualify for tax free pass through of income. Also, many foreign REIT-like entities are deemed for tax purposes as passive foreign investment companies (PFICs), which could result in the receipt of taxable dividends to shareholders at an unfavorable tax rate. Also, because REITS and REIT-like entities typically are invested in a limited number of projects or in a particular market segment, these entities are more susceptible to adverse developments affecting a single project or market segment than more broadly diversified investments. The performance of Real Estate Securities Portfolios may be materially different from the broad equity market.
Fixed Income Portfolios:
The net asset value of a fund that invests in fixed income securities will fluctuate when interest rates rise. An investor can lose principal value investing in a fixed income fund during a rising interest rate environment. The Portfolio may also be affected by: call risk, which is the risk that during periods of falling interest rates, a bond issuer will call or repay a higher-yielding bond before its maturity date; credit risk, which is the risk that a bond issuer will fail to pay interest and principal in a timely manner.
Risk of Banking Concentration:
Focus on the banking industry would link the performance of the short-term fixed income indices to changes in performance of the banking industry generally. For example, a change in the market’s perception of the riskiness of banks compared to non-banks would cause the Portfolio’s values to fluctuate.
The material is solely for informational purposes and shall not constitute an offer to sell or the solicitation to buy securities. The opinions expressed herein represent the current, good faith views of Lake Tahoe Wealth Management, Inc. (LTWM) as of the date indicated and are provided for limited purposes, are not definitive investment advice, and should not be relied on as such. The information presented in this presentation has been developed internally and/or obtained from sources believed to be reliable; however, LTWM does not guarantee the accuracy, adequacy or completeness of such information.
Predictions, opinions, and other information contained in this presentation are subject to change continually and without notice of any kind and may no longer be true after the date indicated. Any forward-looking statements speak only as of the date they are made, and LTWM assumes no duty to and does not undertake to update forward-looking statements. Forward-looking statements are subject to numerous assumptions, risks and uncertainties, which change over time. Actual results could differ materially from those anticipated in forward looking statements. No investment strategy can guarantee performance results. All investments are subject to investment risk, including loss of principal invested.
Lake Tahoe Wealth Management, Inc.is a Registered Investment Advisory Firm with the Securities Exchange Commission.


