The LTWM Insider – Market and Economic Commentary Q1 2026
- 5 hours ago
- 11 min read
Executive Summary
The start of the first quarter was a strong continuation of globally diversified portfolios delivering outsized returns up until the military conflict in Iran started on February 28th. The price of oil spiked, Brent crude surged from $79 to over $100 per barrel and the average gas price in the U.S. increased more than $1 per gallon from just below $3 to over $4. The increased price of gas doesn’t allow the Fed to continue its more accommodative monetary policy and rate cuts are now on hold. This easing of interest rates supported both equity valuations and bond prices throughout 2025. While AI-related mega-cap stocks (the "Magnificent 7") continue to have strong earnings growth, their stock prices have pulled back more than the broad market. The announcement of the Iran cease fire and peace negotiations has led to a sharp bounce off the stock market lows at the end of March and a pullback in the price of crude oil. The futures market for oil is inverted with prices for delivery in the last quarter of 2026 below $80 per barrel, so traders aren’t expecting a prolonged supply shock due to the conflict.
We are pleased to see the latest developments toward potential peace in Iran and the strong stock market results in April. Increasing corporate earnings growth is decreasing the high valuation of U.S. stocks, which are well off of highs for 2026 but slightly above the start of the year. The outperformance of small cap value stocks and the increased breadth of positive gains is solid momentum for the rest of 2026. The Federal Reserve is expected to have a leadership change to a much more accommodative philosophy and a regime of lower interest rates, which would support stock and bond prices.
For those who would like a deeper dive into the details, please continue reading…
World Asset Class 1st Quarter 2026 Index Returns

The first quarter of 2026 was negative for U.S., International Developed and EM stocks but positive for global real estate. For the total U.S. Stock Market, the first quarter return of -3.96% was well below the average quarterly return of 2.3%. International Developed Stocks returned -0.94%, below the long-term average quarterly return of 1.6%. Emerging Market Stocks returned -0.17%, below the average quarterly return of 2.2%. The best quarterly return was Global Real Estate Stocks, which gained 0.77%, slightly below the asset class’s average quarterly return of 2.2%. The U.S. Bond Market was negative, down -0.05%, below its average quarterly return of 1.0%, and the Global Bond Market (ex U.S.) was down -0.19%, below its average quarterly return of 1.0%.
Here is a look at broad index returns over the past year (as of March 31, 2026) and longer time periods (annualized):

For the past year ending 3/31/2026, EM stocks led all broad categories with a positive return of 29.55%, International Developed stocks were up 22.99%, U.S. stocks were up 18.09%, and Global Real Estate stocks were up 7.03%. The U.S. Bond Market gained 4.35% and Global Bonds were up 2.77% for the past year. Over the past five years, U.S. stocks were up 10.87% annually, while International Developed stocks were up 8.4% annually, Emerging Market stocks were up 3.69% annually, and Global Real Estate stocks were up 2.83% annually. The U.S. Bond Market was up 0.31% annually, while Global Bonds were up 1.13% annually. Over the past 10 years, the U.S. stock market (up 13.72% annually) is still ahead of International Developed (up 8.66% annually), Emerging Market stocks (up 7.8% annually) and Global Real Estate stocks (up 3.17% annually). U.S. Bonds were up 2.39% and Global Bonds were up 3.18%, annually, over the last 10 years. You can also view annual returns for 15 and 20 years. The past 15 years have been strong for U.S. stocks, up 12.81% annually over the last decade and a half.
Taking a closer look within U.S. stocks during the first quarter, Small Cap Value took the top spot, up 4.96%, followed by Large Value with a gain of 2.1%. Marketwide stocks were down -3.96% for the quarter and it was an even more challenging quarter for Large Growth stocks, down -9.78%.

If we extend our analysis of U.S. stocks over longer time periods, Small Value stocks now lead over the past year, up 28.09%, while Large Value was up 15.87% and Large Growth was up18.81%. Large Growth has been the top returning asset class in the U.S. over the past 3, 5, 10, 15 and 20 years, outpacing the broad Large Cap category in each of the periods.

The U.S. stock market represents 63% of the global stock market. GDP growth expectations are positive for 2026. The most recent GDP (second estimate) for the 4th quarter of 2025, released on March 13, was for an annual rate of 0.7% and 4.4% for the third quarter of 2025. The latest GDPNow estimate from the Atlanta Fed is for 1.3%, down from 2.7% annual growth one month ago, for the first quarter of 2026. Estimates for the full year of 2026 are also coming down, now between 2-2.2%. Tax cuts and reforms from the OBBBA and earnings growth from the tech sector are expected to drive growth in 2026. The Iran conflict has already sent gas prices in the U.S. to multi year highs, and the price of crude oil is elevated. The announcement of a cease fire and peace talks has sent stocks up during the second week of April. Let’s move on to international stocks.
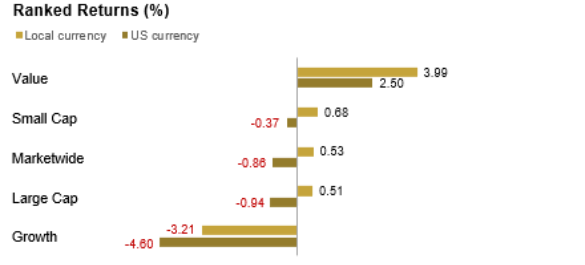
International Developed stocks were positive in local currency and mostly negative in dollars for the first quarter, as the U.S. dollar strengthened against most major currencies. International Value and Small Cap stock returns were above Growth and Large Cap stocks, similar to U.S. stock returns during the quarter. International Value stocks led the fourth quarter, 2.5%, after currency adjustment (up 3.99% in local currency). Growth Stocks were in last, down -4.6% in U.S. dollars, (down -3.21% in local currency). The currency effect served as a more than 1% headwind, hurting international stock returns during the first quarter:
For the past year, ending 3/31/2026, International value led with a strong return of 32.19%, while growth stocks returned 13.95%. Over longer time periods, the value premium (value-growth) is positive for the first quarter, the past one-year period, and the past 3, 5, 10, 15 and 20-year periods. The size factor premium (small cap-large cap) is positive in the past quarter, the 1-year (29.19% vs.22.99), 15-years (6.56% vs. 6.26%), and 20 years (5.49% vs. 5.17%); and negative for the past 3 years (13.77% vs. 14.3%), 5 years (5.4% vs. 8.4%) and 10 years (7.95% vs. 8.66%):

The International Developed Market represents 26% of the global stock market and Emerging Markets represent 11% of the global stock market. International stocks outperformed the U.S. for the full year of 2025 and for the first quarter of 2026. International stocks are playing valuation catch up since they were trading at deep discounts to U.S. stocks at the beginning of 2025. We believe these trends will continue deeper into 2026 if the military conflict in Iran can be resolved quickly without the threat of high oil prices and stagflation.
Moving the commentary to fixed income, bond market returns around the world were positive for short maturities and negative for longer duration bonds during the first quarter. The yield on the 5-year Treasury Note increased by 19 basis points, ending the quarter at a yield of 3.92%, up from 3.73%. The yield on the 10-year Treasury Note increased by 12 basis points, ending the quarter at a yield of 4.3%, up from 4.18%. And the 30-year Treasury bond yield increased by 4 bps to 4.88%, up from 4.84%. As yields increase, bond prices decline, and higher borrowing costs make it more difficult for consumers and corporations to use debt, including auto loans and mortgages. Here is the U.S. yield curve, and you can see how yields increased for intermediate and longer maturities except those at the very long end (current yield curve in grey, one quarter ago in blue, and one year ago in green):

Looking at fixed income asset classes, the highest first quarter bond return was for the shortest maturity US 3-Month Treasury Bill Index (up 0.85%), while the worst return was the U.S. High Yield Corporate Bond Index, down -0.5%. The U.S Aggregate Bond Index was down slightly, -0.05%. It is worth noting that the long bond index was down -4.55% annually for the past five years. Long duration bonds can have significantly negative returns during periods of rising interest rates. Here are the fixed income periodic returns:

The Federal Reserve had their March meeting and held rates steady at a range of 3.5%-3.75% for the second consecutive time and signaled one, possibly two rate cuts later in the year despite surging oil prices. The dot plot predicts one quarter point rate cut in 2026. Jerome Powell has one more meeting left prior to the end of his chairmanship on May 15th. Current military news out of the Middle East is dominating stock and bond movements. Historical military conflicts point to a short drop and strong recovery for stocks if the U.S. avoids recession and right now it is difficult to see a recession in the U.S. economy.
.
CONCLUSION
The strong stock performance so far in April, based on the start of negotiations has reversed the negative returns of the first quarter. The increasing breadth of U.S. stock leadership is supportive of a continuation of the bull market. The next quarter should bring a more accommodative leader to the Federal Reserve. The valuation of the S&P 500 remains elevated, and leadership has transitioned to small cap and international stocks. This is the reason we hold globally diversified portfolios, which we continue to believe will do well through the rest of this year.
Our recommendation is to stay disciplined with investments, tune out the news and focus on what you can control with your financial plan. We are here to help you succeed and look forward to seeing you soon.
Standardized Performance Data and Disclosures
Russell data © Russell Investment Group 1995-2025, all rights reserved. Dow Jones data provided by Dow Jones Indexes. MSCI data copyright MSCI 2025, all rights reserved. S&P data provided by Standard & Poor’s Index Services Group. The BofA Merrill Lynch Indices are used with permission; © 2025 Merrill Lynch, Pierce, Fenner & Smith Inc.; all rights reserved. Citigroup bond indices copyright 2025 by Citigroup. Barclays data provided by Barclays Bank PLC. Indices are not available for direct investment; their performance does not reflect the expenses associated with the management of an actual portfolio.
Past performance is no guarantee of future results. This information is provided for educational purposes only and should not be considered investment advice or a solicitation to buy or sell securities. Diversification does not guarantee investment returns and does not eliminate the risk of loss.
Investing risks include loss of principal and fluctuating value. Small cap securities are subject to greater volatility than those in other asset categories. International investing involves special risks such as currency fluctuation and political instability. Investing in emerging markets may accentuate these risks. Sector-specific investments can also increase these risks.
Fixed income securities are subject to increased loss of principal during periods of rising interest rates. Fixed-income investments are subject to various other risks including changes in credit quality, liquidity, prepayments, and other factors. REIT risks include changes in real estate values and property taxes, interest rates, cash flow of underlying real estate assets, supply and demand, and the management skill and creditworthiness of the issuer.
Principal Risks:
The principal risks of investing may include one or more of the following: market risk, small companies risk, risk of concentrating in the real estate industry, foreign securities risk and currencies risk, emerging markets risk, banking concentration risk, foreign government debt risk, interest rate risk, risk of investing for inflation protection, credit risk, risk of municipal securities, derivatives risk, securities lending risk, call risk, liquidity risk, income risk. Value investment risk. Investing strategy risk. To more fully understand the risks related to investment in the funds, investors should read each fund’s prospectus.
Investments in foreign issuers are subject to certain considerations that are not associated with investment in US public companies. Investment in the International Equity, Emerging Markets Equity and the Global Fixed Income Portfolios and Indices will be denominated in foreign currencies. Changes in the relative value of these foreign currencies and the US dollar, therefore, will affect the value of investments in the Portfolios. However, the Global Fixed Income Portfolios and Indices may utilize forward currency contracts to attempt to protect against uncertainty in the level of future currency rates (if applicable), to hedge against fluctuations in currency exchange rates or to transfer balances from one currency to another. Foreign Securities prices may decline or fluctuate because of (a) economic or political actions of foreign governments, and/or (b) less regulated or liquid securities markets.
The Real Estate Indices are each concentrated in the real estate industry. The exclusive focus by Real Estate Securities Portfolios on the real estate industry will cause the Real Estate Securities Portfolios to be exposed to the general risks of direct real estate ownership. The value of securities in the real estate industry can be affected by changes in real estate values and rental income, property taxes, and tax and regulatory requirements. Also, the value of securities in the real estate industry may decline with changes in interest rate. Investing in REITS and REIT-like entities involves certain unique risks in addition to those risks associated with investing in the real estate industry in general. REITS and REIT-like entities are dependent upon management skill, may not be diversified, and are subject to heavy cash flow dependency and self-liquidations. REITS and REIT-like entities also are subject to the possibility of failing to qualify for tax free pass through of income. Also, many foreign REIT-like entities are deemed for tax purposes as passive foreign investment companies (PFICs), which could result in the receipt of taxable dividends to shareholders at an unfavorable tax rate. Also, because REITS and REIT-like entities typically are invested in a limited number of projects or in a particular market segment, these entities are more susceptible to adverse developments affecting a single project or market segment than more broadly diversified investments. The performance of Real Estate Securities Portfolios may be materially different from the broad equity market.
Fixed Income Portfolios:
The net asset value of a fund that invests in fixed income securities will fluctuate when interest rates rise. An investor can lose principal value investing in a fixed income fund during a rising interest rate environment. The Portfolio may also be affected by: call risk, which is the risk that during periods of falling interest rates, a bond issuer will call or repay a higher-yielding bond before its maturity date; credit risk, which is the risk that a bond issuer will fail to pay interest and principal in a timely manner.
Risk of Banking Concentration:
Focus on the banking industry would link the performance of the short-term fixed income indices to changes in performance of the banking industry generally. For example, a change in the market’s perception of the riskiness of banks compared to non-banks would cause the Portfolio’s values to fluctuate.
The material is solely for informational purposes and shall not constitute an offer to sell or the solicitation to buy securities. The opinions expressed herein represent the current, good faith views of Lake Tahoe Wealth Management, Inc. (LTWM) as of the date indicated and are provided for limited purposes, are not definitive investment advice, and should not be relied on as such. The information presented in this presentation has been developed internally and/or obtained from sources believed to be reliable; however, LTWM does not guarantee the accuracy, adequacy or completeness of such information.
Predictions, opinions, and other information contained in this presentation are subject to change continually and without notice of any kind and may no longer be true after the date indicated. Any forward-looking statements speak only as of the date they are made, and LTWM assumes no duty to and does not undertake to update forward-looking statements. Forward-looking statements are subject to numerous assumptions, risks and uncertainties, which change over time. Actual results could differ materially from those anticipated in forward looking statements. No investment strategy can guarantee performance results. All investments are subject to investment risk, including loss of principal invested.
Lake Tahoe Wealth Management, Inc.is a Registered Investment Advisory Firm with the Securities Exchange Commission.


